 |
|


 |


 |
    |
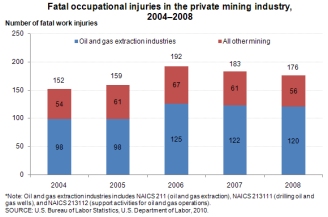
To say that hydraulic fracturing is a dangerous business is an understatement. The fact is that it is one of the MOST dangerous businesses, as borne out by statistics and facts compiled by the US Department of Labor, Bureau of Labor Statistics. And, Texas leads the nation in the number of fatal and non-fatal injuries associated with the exploration and production of natural gas.
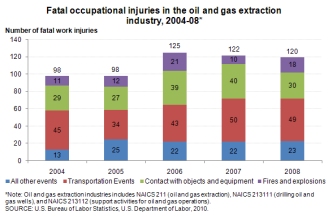
The information presented below only applies to worker deaths and injuries, and does not include deaths and injuries to those who are not affiliated with the exploration and production activities in any way. Industry "trade secrets" and settlements with non-disclosure mandates prevent knowing the true number of deaths and injuries related to hydraulic fracturing activities, which include sand mining, transportation on public roads, building pad sites, drilling, frac'ing, completing and producing natural gas, and pipeline transmission to compressor stations or distribution to customer locations. Deaths Related to Hydraulic Fracturing: The number of workers killed in Texas "mining", as the Department of Labor classifies oil and gas drilling, has risen in the past decade. Deaths rose from 35 in 2003 to a high of 49 in 2007 and totaled 45 in 2010. According to government data, from 2003 to 2008, 648 workers were fatally injured nationwide, resulting in a fatality rate for gas and oil extraction workers that was eight times higher than the average of all occupations. Oil and Gas Industry Fatal and Nonfatal Occupational Injuries Oil and gas industries are frequently in the news. Much of the time this news is related to changes in prices of oil and gas, which affect most consumers in one way or another. Another less frequent subject of media attention is when disasters strike, as in the offshore oil drilling platform explosion and fire on April 20, 2010, and previous incidents such as the Clearbrook, Minnesota pipeline fire in 2007 and the Texas City, Texas refinery explosion in 2005. According to the North American Industry Classification System, the oil and gas extraction industry is classified in mining, as all mining industries are focused on extracting natural resources from the earth. Drilling oil and gas wells and support activities for oil and gas operations are classified under support activities for mining. Fatal injury data include oil and gas extraction, drilling oil and gas wells, and support activities for oil and gas extraction. Nonfatal injury and illness data only include drilling oil and gas wells. Occupational injuries and fatalities associated with fires and explosions are rare events. The overall rate of injuries and illnesses with days away from work due to fires and explosions in all industries was 0.2 per 10,000 full-time workers in 2008, composed of 2,320 cases with days away from work. There were 174 fatal injuries due to fires and explosions in 2008, 18 of which were in the oil and gas industry 1. Fatal Work Injuries A total of 120 fatal work injuries occurred in the oil and gas extraction industry in 2008. The three most frequent fatal events in 2008 were transportation incidents (41 percent), contact with objects and equipment (25 percent), and fires and explosions (15 percent). The number of fatal work injuries associated with fires and explosions over the past five years ranged from 10 fatalities in 2007 to 21 fatalities in 2006. In 2008, there were 18 fatalities. Of the transportation incidents in 2008, three-quarters involved highway incidents. There were four fatal work injuries where a pedestrian was struck by a vehicle or mobile equipment and five aircraft fatal work injuries in 2008. Workers who were fatally injured after being struck by objects and equipment accounted for 22 of the 30 fatal work injuries involving contact with objects and equipment. In 2008, multiple-fatal work injury events accounted for 24 worker deaths in 10 different incidents. More than half of these deaths were caused by transportation events, while a third were from fires and explosions. The three states with the most oil and gas extraction industry fatal work injuries in 2008 were Texas (41 fatal work injuries), Oklahoma (21 fatal work injuries), and Louisiana (13 fatal work injuries). Over the five-year period of 2004-2008, Oklahoma fatal work injuries in the industry have increased 91 percent, while Texas has increased by 21 percent and Louisiana by 30 percent. Support activities for oil and gas operations (NAICS 213112) account for about half of fatal work injuries from 2004 to 2008 in oil and gas industries on average, with 69 fatal work injuries recorded in 2008. Drilling oil and gas wells (NAICS 213111) averaged 34 fatal work injuries over the five-year period, with 37 percent of fatal work injuries resulting from contact with objects of equipment. Oil and Gas Extraction (NAICS 211111) had an average of 21 fatal work injuries.
Nonfatal Injuries Drilling oil and gas wells (NAICS 213111) is a distinct industry from oil and gas production, and is classified under support activities for mining. Establishments in this industry are primarily engaged in drilling oil and gas wells for others on a contract or fee basis. This industry includes contractors that specialize in spudding in, drilling in, redrilling, and directional drilling. From 2003 to 2007, the most recent data available for drilling oil and gas wells, the number of total recordable cases of nonfatal injuries and illnesses ranged between 2,400 in 2003 and 4,700 in 2005, with 2007 having 4,200 cases. The rate of injuries and illnesses ranged from 4.0 per 100 full-time workers in 2003 to 6.8 in 2004, with a rate of 4.6 in 2007. This is a little higher than the rate of 4.2 per 100 full-time workers for all industries.
To be sure, not all fatal and non-fatal injuries and illnesses occur among workers in the gas extraction industry. There are many cases where nearby residents were adversely affected, however pinpointing these cases and compiling statistics has been hampered by financial settlements with non-disclosure agreements wherein industry did not admit guilt, but paid people who were injured in return for their silence. This tactic should be outlawed, and all reported cases of injury and illness, with or without fatalities, should be reported so that the medical profession can be better informed and prepared to deal with emergencies and exposures, and the general population can be more informed when considering lease agreements for mineral rights they own. Data obtained from the U.S. Department of Transportation, Pipeline & Hazardous Materials Safety Administration (PHMSA) has relealed the extend of damages caused by incidents including fugative emissions leaks, pipeline explosions and other hazardous materials exposures to be at such levels that should be of concern to most people. The following data presents the number of incidents, fatalities, injuries and monetary losses that have occurred in natural gas gathering, transmission and distribution 2000-2011, from onshore pipeline operations. To clarify the data, gathering lines are those which move natural gas or petroleum from wells to processing or transmission facilities. Transmission lines are high-pressure, long distance lines that carry natural gas from principal supply areas to distribution centers, large volume customers or other transmission lines. Distribution lines carry natural gas from the gas company's facilities to the end-user consumer.
San Bruno, California Pipeline Explosion 1 Fatal injury numbers for oil and gas extraction industries are based on the North American Industry Classification System (NAICS), 2002 and include NAICS 211 (oil and gas extraction), NAICS 213111 (drilling oil and gas wells), and NAICS 213112 (support activities for oil and gas operations). These include both public and private sector. 2 U.S. Department of Transportation, Pipeline & Hazardous Materials Safety Administration | |||||||||||||||||||||||||||||||
 Copyright © 2010-2013, Marc W. McCord. All rights reserved. CobraGraphics is the trademark of Marc W. McCord dba CobraGraphics. The textual, graphic, audio, and audio/visual material in this site is protected by United States copyright law and international treaties. You may not copy, distribute, or use these materials except for your personal, non-commercial use. Any trademarks are the property of their respective owners. All original photographic images are the exclusive property of Marc W. McCord or other designated photographers and may not be copied, duplicated, reproduced, distributed or used in any manner without prior written permission of the copyright owner under penalty of US and International laws and treaties. |